The Zachman Framework™ has evolved over time and has a rich history in the space we call "Enterprise Architecture." While the fundamental concepts have not changed at all, refinements to its graphical representation, in addition to more precise language, embody The Framework's history and what you see today. Here is a brief trip down its historical evolution...

The Zachman Framework Evolution
1984
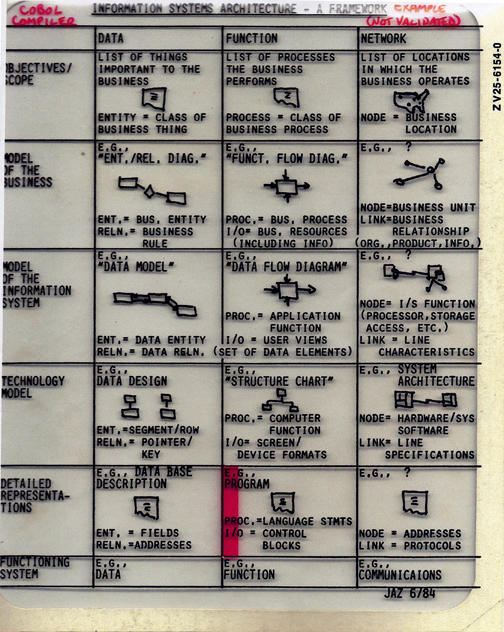
Never seen until now, this is the original Zachman Framework: Information Systems Architecture - A Framework, by John A. Zachman. Created in June of 1984, this was a crude representation that John created himself of what would later be referred to as The Zachman Framework™.
Notice it has only 3 Columns. While all 6 Columns did actually exist, John was nervous that people might not be able to fully appreciate (or be willing to accept) his thoughts, particularly since Enterprise Architecture hadn't been born yet and this was a Framework for INFORMATION SYSTEMS architecture.
Also notice Column 1, Row 2 contains a Chen Diagram, Row 3 contains a Bachman Diagram and Row 4 has an IMS Root-Segment Diagram. Also, Column 2, Rows 2 & 3 contain IDEF0 notation. These notations were the best available at the time as John was formulating what Architecture was relative to Enterprises. John would later realize that these notations (or models of The Framework) were representations of “Composite” constructs in the Enterprise Architecture. This would become a FUNDAMENTAL distinction that would revolutionize how people thought about Enterprise Architecture - “Primitive” models versus “Composite” models - and be the FOUNDATION for how John would later define the concepts of dealing with complexity and change. More on this later...
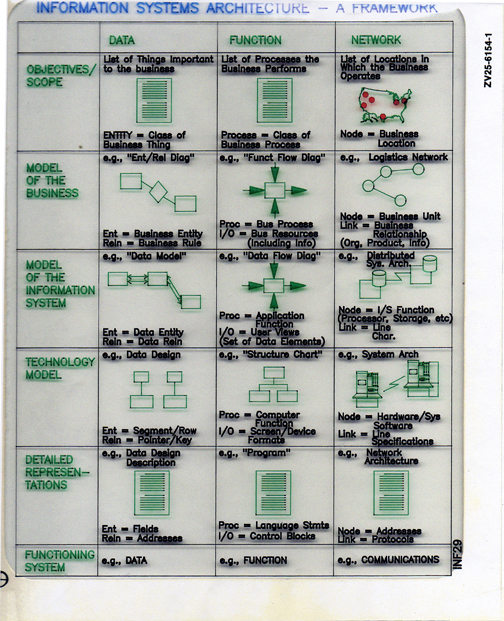
1984
This representation of The Framework was created from John's original drawings by IBM graphics support. John used this graphic until he retired from IBM in 1990.
Notice the original title: Information Systems Architecture - A Framework. Also, notice the "diamond" in the Column 1, Row 2 Chen notation model. John would later remove this because this representation is a composite view of that particular cell. The "diamond" is a representation of a process (a verb) connecting two entities (nouns), which violates the later developed fundamental Framework rule that cells can only contain primitive constructs, not composites (i.e.: no processes can be in that particular cell: Column 1, Row 2). This is a perfect example of what we would call a composite model today, not a primitive model.
Also notice the IDEF0 notations in Column 2, Rows 2 & 3. These are also a composite view because of the vertical arrows. These are not pure, primitive models.
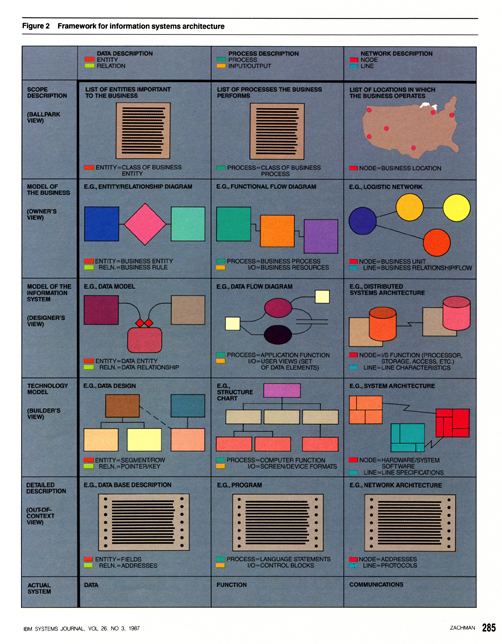
1987
This is the original, and first published, Framework for Information Systems Architecture, appearing in the 1987 IBM Systems Journal. Notice that only the first 3 Columns made it, in spite of all 6 actually existing. Most people had no concept of thinking about Architecture being for the ENTIRE Enterprise or "Enterprise Architecture" as John would later coin. Since The Framework was originally published for I/S, there was no precedent set for thoughts about Responsibility (Column 4), Timing (Column 5) or Motivation (Column 6). Notice the composite model in Column 1, Row 2 as defined above in addition to some of the other notation changes.
1992
Still called A Framework for Information Systems Architecture in the 1992 IBM Systems Journal article, Enterprise Architecture was starting to gain a small amount of recognition based on John's ideas that strategy and information systems needed to be "engineered" for the ENTIRE Enterprise, not just "manufactured" by the I/S department. However, this Framework so revolutionized the I/S concept that existed at this time, that people began to refer to this Framework, and the previous Frameworks, as The Zachman Framework™.
This artist's rendition is fairly close to John's original graphic. Note that John added the words "Owner," "Designer," and "Builder" to Rows 2, 3 and 4 for clarification. John Sowa (co-author of the 1992 article) said, "Oh, we can call Row 1 'Planner,' and Row 5 'Sub-Contractor.'"
Also note that the cells of Columns 4, 5 & 6 are each populated with the same model. The I/S community, at that time, did not have much experience, or notion, for the models in those Columns, so these are John's personal models that he used in each of those Rows.
1993
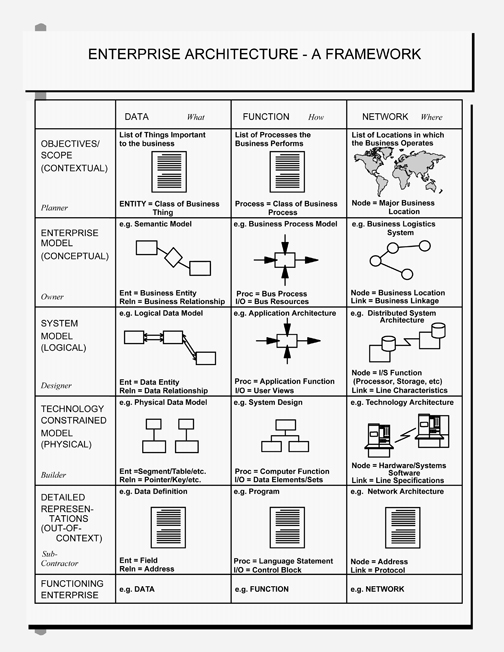
It was at this point that John decided to officially call his Framework: Enterprise Architecture - A Framework. He had recently formed his consulting and education company, Zachman International® nearly two years earlier and had been using the term "Enterprise Architecture" for some time. He felt convinced that people would be more willing to accept his ideas about “Enterprise” Architecture as opposed to “Information Systems” Architecture.
This version is still a minor carry-over from the 1987 article as it only has 3 columns. John used only the first three columns when teaching about The Framework because of the dominant I/S perspective that still existed at the time. He was afraid to overtly discuss the “other three Columns” because people, particularly the I/S people, might become discouraged and give up!
Notice that this version is the first to use the adjectives "Contextual," "Conceptual," "Logical," "Physical" and "Out-of Context" when defining the Rows. John used these terms in an attempt to convey that each Row was a representation of a TRANSFORMATION when moving down each Column- NOT another layer of detail (more on this later).
Column 2, Row 3 "Business Process Model" came from the 1990 book. Re-engineering the Corporation which popularized the words "Business Process."
There were some minor problems with this Framework which were actually rooted back from its inception. The first (noted earlier) is the use of the Chen Diagram in Column 1, Row 2. This is still a composite model - the diamond indicates a process (or verb) hard-bound in the Inventory (thing) model, making that model totally inflexible. The Column 2, Rows 2 & 3 IDEF0 notation are also composite models- the vertical arrows represent controls and mechanisms on these process models, making them a composite as well (hard-biding multiple meta-entities into one model). Also notice the Column 1, Row 4 model (IMS Root-Segment) is a hierarchy, which is a problem because nothing can be normalized in a hierarchy because you end up with things showing up in more than one place. Each of these models were changed in later versions to better support the “Primitive” model concept John had conceived.
In addition, observe the map in Column 3, Row 1. The map changed from a US map (1992 version above) to a World map because of John's first seminar in Australia, truly making Zachman International®, international. This representation however, is actually quite an inaccurate model, because the map is an instantiation which belongs in Row 6- (see more detail about this below in the 2001 version).
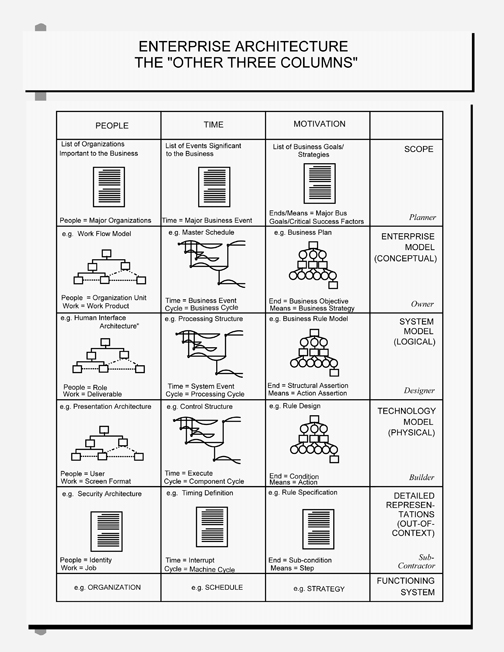
1993
Several of John's friends from the Business Rules community persistently pressed him to talk about "The Other Three Columns," because it is from Column 6 from which the “Business Rules” are derived. This "version," while not widely distributed was part of John's lecture series on "What is Enterprise Architecture" as evidenced by the title of this version: Enterprise Architecture- The Other Three Columns.
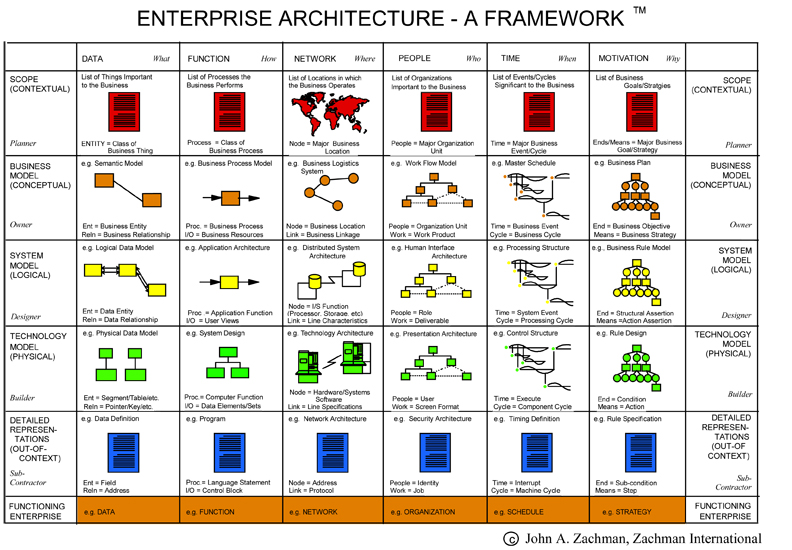
2001
During this time, Enterprise Architecture was really gaining ground due to John's thoughts about the subject. Fully recognized as The Zachman Framework™, this version was very widely distributed and had many of the refinements from the previous 10 years of research.
In particular, notice the model in Column 1, Row 2 is no longer an early Chen Diagram because Peter Chen had actually removed the diamond from his notation just before the release of this Framework graphic. Removal of the "diamond," or process (verb) made this model "primitive." Also, the controls and mechanisms (vertical arrows which were integral to the IDEF0 Process Modeling notation) were removed from the Column 2, Rows 2 & 3 models. It does, however, still contain the IMS Root-Segment notation in Column 1, Row 4.
The colors of the models in each Row are significant here. John used the color models as a teaching tool to re-enforce the idea that each Row is different and is the result of a transformation, NOT a decomposition of detail (more on this later). It is difficult to graphically depict this idea with black lines on a white background in order to form the cells of the matrix; but John was attempting to depict this concept with the use of color. He used spectrum colors: Red, Orange, Yellow, Green, Blue and Orange. Most people ask why he didn’t round out the spectrum with Purple in Row 6. He answers that, "Row 6 is Orange to match Row 2; because whatever the Owners have in mind (Row 2 - Business Concepts - Orange) should be what is actually instantiated in the Enterprise (Row 6 – THE ENTERPRISE - Orange)."
As you can also see, while Row 6 existed, the Functioning Enterprise wasn't fully acknowledged as part of The Framework yet, but John was re-thinking this idea heavily. Without Row 6, people had the tendency embed instances into their architecture- making it VERY inflexible. The instance (when embedded in the higher Rows) will bind things together. Proper nouns belong in Row 6 and generally mean you have in instance. Common nouns imply you have a set- which can be counted. Abstractions belong in the first five Rows- instances belong in Row 6 (i.e.: Stockholm can not be in Row 1 because it is an instance of capital cities. Stockholm belongs in Row 6, because it is the instantiation of the scoping context of capital cities which would be in Row 1). Technically, Architecture is always ABSTRACTIONS (Rows 1-5), whereas the RESULT of Architecture - THE ENTERPRISE (instances) - are always Row 6.
Continuing with this idea is one more small flaw that continued to show up until the 2004 version. The picture (or model) of the World map in Column 3, Row 1 (Network) is grossly inaccurate. John liked it for its aesthetic value, the artistic contribution, however, the inaccuracy is in the fact that the World map is a representation of a physical place, which is actually an instantiation (Row 6) of the scope (Row 1). The Row 1 models are scoping lists and nothing more, not instances. If anything, the picture (or model) of the World map belongs in Row 6. While this was done as more of a tribute to the original Framework (see above), John would later point out that this would lead to potential confusion in the Framework fundamental concept and was subsequently changed in a later version.
In addition, to John's regret, he named Column 1 "Data," which he feels inaccurately continued to classify The Zachman Framework™ as a Framework for Information Systems, despite having "Enterprise Architecture" titled across the top. In fact, most of the terminology in this Framework is I/S related which further perpetuated the misconception that the Framework, and Enterprise Architecture for that matter, were an I/T issue.
One other significant problem with this Framework is its rampant use of adjectives. Adjectives are not countable sets, they are always subject to interpretation and therefore make the concepts here dramatically less precise.
Baring these deficiencies however, this Framework was instantly and widely accepted as a representation for Enterprise Architecture and proliferated its way across the globe very quickly.
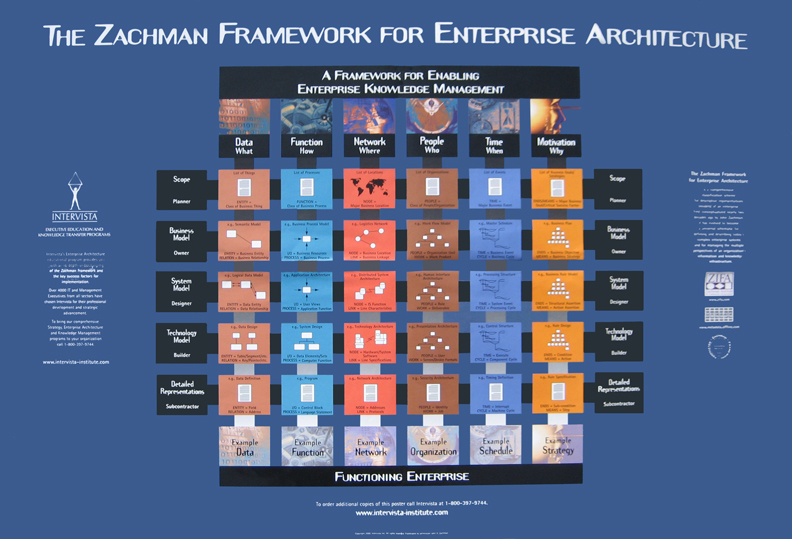
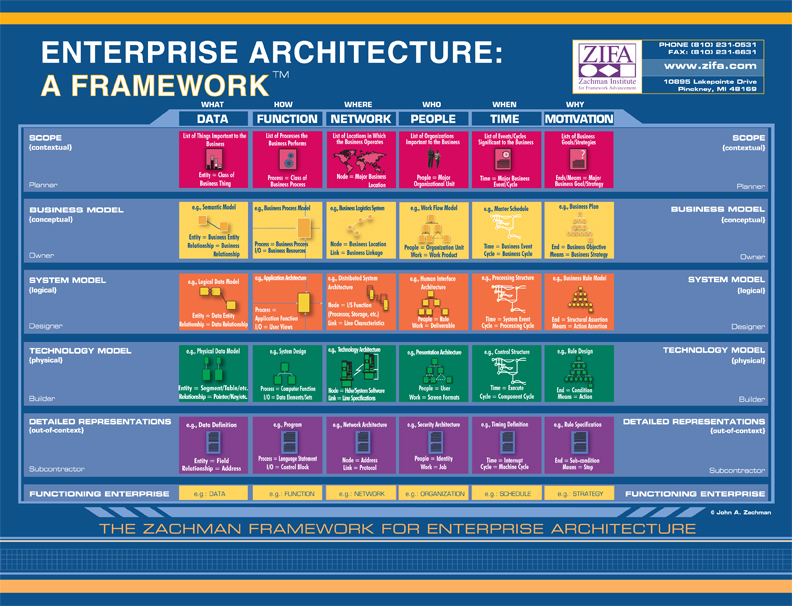
2002
This graphic was developed by Intervista-Institute in Canada, whom we still work with extensively. After obtaining copyright clearance from John, and with his development help, this was a HUGE upgrade in aesthetics and graphic design. While this representation of The Framework was the most attractive aesthetically, it still contained Information Systems terminology, lots of adjectives, a deemphasized Row 6, the IDEF0 notation in Column 2, Row 2, and the IMS Root-Segment notation in Column 1, Row 4.
One significant improvement in this version however, is the use of the black to white gradient, vertical banding, which works its way down the columns. This gradient significantly emphasized that there is more going on with The Framework than just a matrix. This de-emphasized people's misperception that working your way down the columns is merely an increase in level of detail. This is still a misconception about The Zachman Framework™ today and the black to white gradient was an attempt to correct this fundamental misinterpretation. The movement down each column has nothing to do with level of detail; it has to do with transformation.
This Framework illustration helped emphasize the transformation concept of the Columns.
2003
Developed at roughly the same time period, this was a very widely distributed, and very recognizable representation of The Zachman Framework™ because of its development during the time when ZIFA existed. Some of the ZIFA partners, other than John, were unsatisfied with the Intervista version (above) which was a more aesthetically pleasing version and showed the Transformation black-to-white gradient banding down the Columns. The objection was related to the predominant Intervista advertising despite the ZIFA logo on the right of the 2002 representation. Therefore, they commissioned this version, which surprisingly reverted to earlier notation problems and only had reference to ZIFA.
This Framework does have some significant shortcomings. It still contains I/S terminology, not the current Enterprise terminology, in addition to an extensive use of less-precise adjectives (which proliferates ambiguity in interpretation) and a minimized Row 6, even worse than the Intervista version above.
Most surprisingly however, notice that the IDEF0 notation made its way back into Column 2, Rows 2 & 3 which violated the fundamental rule of The Framework about no cell containing composite constructs. The vertical arrows make those processes dependent on some control or mechanism which destroys the primitive (or "Periodic Table") idea of The Framework. John had made this correction in his 2001 version above, but it unfortunately came back in this version.
In addition, the colors of Rows 2 and 3 became inverted and purple was added to Row 5.
Because of the predominate use of color in each Row, this Framework illustration emphasizes the Integration concept of the Rows.
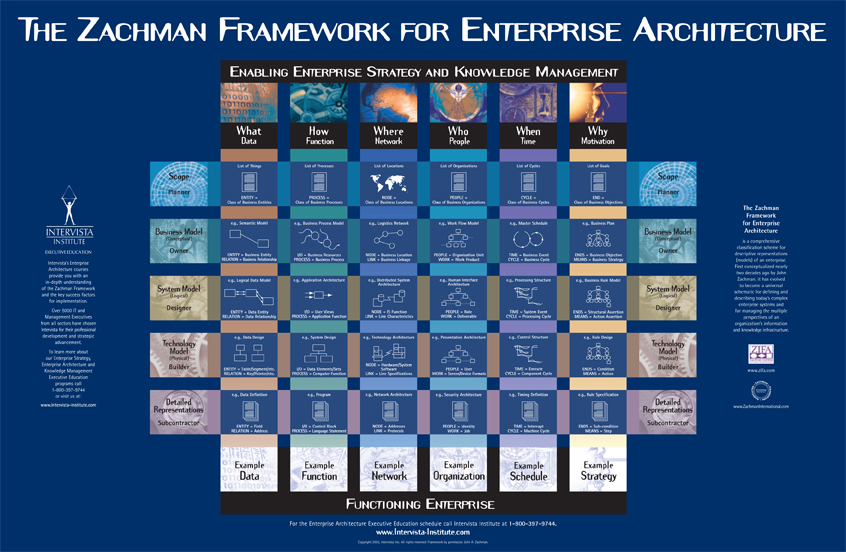
2003
Developed in 2003, this graphic was a minor variation of the graphic from 2002 (above), also developed by Intervista Institute in Canada. This representation was most certainly the most pleasing aesthetically up to that time.
The changes were minor from the previous version- it still contained Information Systems terminology, adjectives and a de-emphasized Row 6. However, the most significant improvement in this version however, is the use of the gradient color banding across the Rows and down the Columns. This gradient color banding between each cell best illustrates the concepts of Integration (across the Rows) and Transformations (down the Columns) above all previous versions of The Framework because each cell stands alone which creates space between them and the ability to depict that more is going on.
Also, the IDEF0 notation was changed in Column 2, Row 2. In addition, the model in Column 5, Row 2 was changed to a "circular" icon which did not convey the idea of "event-cycle-event" very well and was subsequently changed. However, the IMS Root-Segment notation was still used Column 1, Row 4 and the Bachman diagram in Column 1, Row 3.
The brilliance of this Framework illustration was that it emphasized both the integration concepts of the Rows and transformation concepts of the Columns.
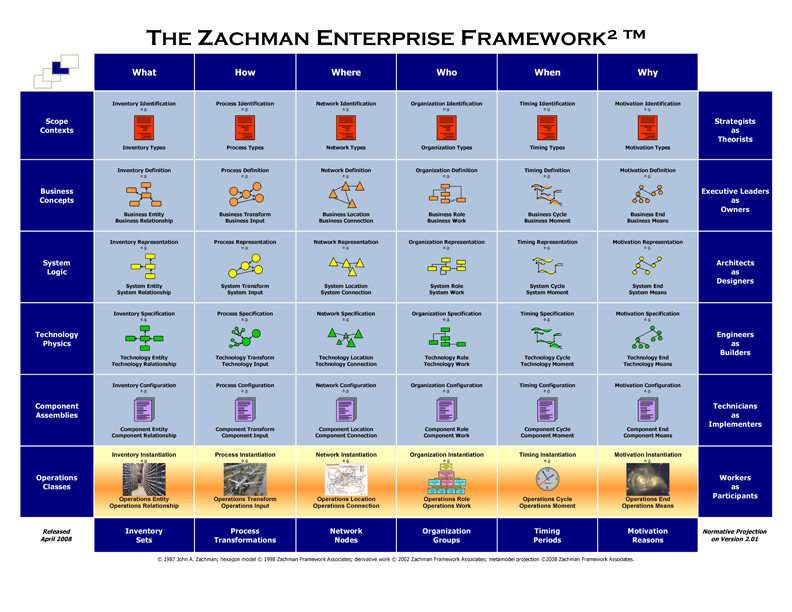
2004
Much to John’s chagrin, this version of The Zachman Framework was titled The Zachman Framework2™, and was developed in 2004. John never liked the “squared” in the title, but because of the internal structure of Zachman International at the time, he was forced to accept the change. The superscript “2” was added to indicate that this was the “2nd version” of John’s most recognizable, 6-column representation- the 2001 version.
Aside from this however, this version did mark some very significant changes that John was pleased about. Most notably is the migration away from I/S terminology to more generic Business terminology which had helped make tremendous strides in getting the Framework in front of General Management as opposed to just hanging on the walls of I/T shops. Also, the use of noun-modified nouns (instead of adjective-modified nouns) makes this version much more precise.
Other improvements include the removal of the World map model in Column 3, Row 1 (see 2001 version above), more representative “Primitive” model notation in the Columns and no Instantiations other than in Row 6.
One very significant problem that persists with this version however, is that this graphic representation uses only white lines on a light blue background in order to form the matrix; making it is impossible to convey the idea of Integration and Transformation (as referred to earlier, this was a problem with many of the previous representations as well, sans the Intervista renditions above). While this Framework had many improvements, it did nothing to convey the idea of TRANSFORMATION when moving from the top to the bottom of each column. Intervista attempted this with moderate success by their use of gradients (2002 & 2003 versions above), however this 2004 version continued to facilitate many EAs to wrongly assume that each Row of the Framework merely represented an increase in the level of detail, or “waterfall,” as the Architects move their way down each Row vertically.
By the same token, this problem persists horizontally as well. There is NO indication that INTEGRATION exists between the Columns. This was also a serious problem, because many EAs were building Composite models and hard-binding multiple concepts together in their Architecture, rather than separating independent variables and then integrating the variables across each Row.
Because of the limitations of using single lines to create the cells of a matrix, much confusion continued to be perpetuated by this version (stemming back to The Framework's inception). These FUNDAMENTAL concepts that The Zachman Framework has always embodied: the models of the Enterprise INTEGRATE horizontally, and they TRANSFORM vertically are difficult to depict graphically. Due to the fact that these concepts were not graphically evident in this version, it was left up to the Zachman Certified™ certification instructors to convey this point. These foundational issues were subsequently addressed in the next version.
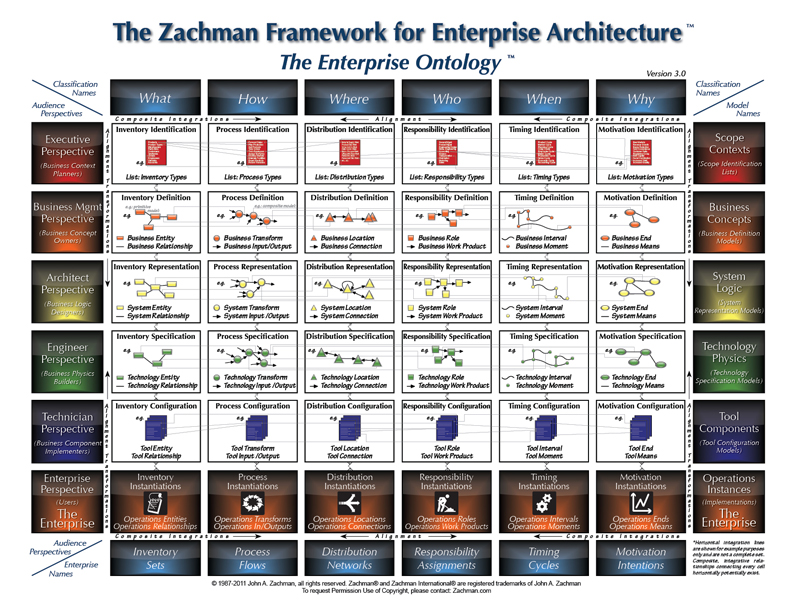
2011
After a few years of internal re-structure within Zachman International, John proceeded with a new version of the Framework, unfettered by any outside influence. This was the only version since 2001 that John had complete control over and graphically designed totally in-house. The significance of this, during its 12 months of development, was that John was able to make all the decisions about content changes without any internal push-back. In addition, not wanting to alienate the community or be perceived as a dogmatic, self-imposed authority on EA, John solicited input from key people in the EA space at this version’s near completion in 2011. John looked for input from representative members of the academic and consulting communities, from leading authorities in the data and process modeling communities, experts in distribution and Business Rules and from key tool vendors. Armed with input from these various authorities, he made several final adjustments to the image that would finally represent the most EA-inclusive representation of The Zachman Framework, containing all the improvements in the evolution of John’s, and the community’s, understanding of Enterprise Architecture and The Zachman Framework over the last 40 years.
Aesthetically, it is a tribute to his original 2001 Framework image and subsequent versions. It’s labeled with a “Version 3.0,” because it is the third graphic representation (1st-2001, 2nd-2004) that John had all, or most of, the control of its production.
The most striking changes start with an upgrade in the graphics (i.e.: translucent outer banding, metallic models, etc.) However, these superficial changes pale in comparison to some of the significant content changes and changes to the meta-model.
First, you’ll notice this graphic is subtitled, “The Enterprise Ontology.” This suggestion came from the folks in the academic community. They were observing that there are many “Frameworks” in EA and that there is significant confusion about what the word “Framework” actually means. Sadly, this confusion erroneously puts The Zachman Framework in competition with these other “Frameworks,” rather than in support of them. Most of the confusion about the various “Frameworks,” stems from the fact that the majority of EA “Frameworks” in the industry are methodologies derived from the The Zachman Framework. The Zachman Framework clearly has no methodological implications. John’s Framework is an ontology- or the complete set of all the “elements” that exist in the Enterprise (much like what the Periodic Table of Elements is to Chemistry). It infers nothing about HOW EA is done, it only defines the SCIENCE of what EA is... or the ontology. The academics polled, suggested changing the name of The Framework to: The Zachman Ontology for Enterprise Architecture. While this would definitively be more accurate, and move The Zachman Framework out of competition with other EA "frameworks," John prudently decided not to discard 40 years of momentum in the industry that the title of his Framework holds. Therefore, he decided to subtitle this version to indicate there is more going on than just another alternative to EA Frameworks, and that The Zachman Framework actually supports all of them.
Next, this representation’s most obvious change is the addition of the “Integration lines” linking ontological elements between the columns. As previously stated, integration across the Rows has been a common misunderstanding perpetuated by previous versions, due to the artistic difficulty to represent this graphically. Therefore, John represented integration between the cells with these lines.
Closely related to this are the “crooked” transformation notations between the cells vertically. This issue has become even more misunderstood over the years than the integration between cells. Also stated earlier, most people who mis-represent The Zachman Framework as a “waterfall," think that each Row represents another level of detail, i.e.: the highest level of detail at the top of The Framework (Row 1) and the most excruciating level of detail at the bottom of The Framework (Row 5). This is not the case at all. The models of each Row TRANSFORM- they do not get more detailed. Level of detail is represented in the height of each cell, i.e.: a high level of detail at the top EACH CELL and an excruciating level of detail at the bottom OF EACH CELL, NOT as you work your way down the Rows of each Column. After testing several different transformation notations with the test groups, one very well known name in the Business Rules community suggested the “crooked arrow” notation to indicate transformation; John did not waste any time implementing.
The models in each cell are re-designed and transformed to the next Row below, and a complete Row 6 wraps up the 6th phase of reification (the 2000 year old well-known, process for turning an abstract idea into reality: Identification-Row 1, Definition-Row 2, Representation- Row 3, Specification-Row 4, Configuration-Row 5 and Instantiation-Row 6), further proving The Framework's fundamental concept of transformation, not decomposition, in the reification process down each column- an idea (or Scope-Row 1) has to go through 6 well-known phases in order to reach reality (Operations-Row 6) such that the reality retains an alignment with the initial idea as it was conceived and designed. It also encourages architects to get embedded instances out of their architecture and make sure instances are only recorded in Row 6 (see 2001 version above). The instantiated Enterprise is represented in Row 6 whereas Enterprise Architecture is comprised of Rows 1-5.
The terminology banding around the outside of the matrix have been selected to include names from the Enterprise and as well as John’s original names deriving from the older disciplines of Engineering and Manufacturing and Architecture and Construction.
Audience perspectives have been labeled, moved from the right to the left to further attract the attention of General Management as well as have been refined.
After extensive research it was also clear that the meta-model of the Framework needed looking after and further fine-tuning. Business Process experts suggested changing the Column 2 name from Process Transformations (2004 above) to Process Flows- a more descriptive representation of this column to General Management. Also, Column 3 (Network Nodes- 2004 Version) was grossly misunderstood because of this terminology. EAs often thought of this as point-to-point nodes and were not building their models correctly. John had been talking quite extensively that the fundamental concept of this Column deals with distribution of resources as opposed to node addresses on a network. Column 3 and it’s Column 6 icon changed to Distribution Networks, a FAR better description for this Column.
Additional meta-model changes occurred in Columns 5 & 6 as well. The 2004 version confused quite a number of people with its title: Organization Groups. As soon as Enterprise Architects saw this label, they incorrectly assumed: Organizational Chart- not so. This Column is all about responsibility; in which case John aptly changed the meta-model to form the title Responsibility Assignments for Column 4; to which there have already been rave reviews. Last is Column 5 changing from the 2004 version Timing Periods, to Timing Cycles- again, more descriptive for the new intended audience.
There are a few more changes to the meta-model names down some of the columns, some refinement of descriptive terms, labeling of model examples, a change to icons in Row 6 for an updated look and a few others (a book detailing these changes will be released shortly- register at Zachman.com for notification of release).
All in all, the 2011 Zachman Framework Version 3.0 is by far the most descriptive Framework graphic ever produced, and one that John actually stands behind as THE authoritative culmination of his work thus far. The Zachman Framework™ is a classification theory about the scientific nature of any Enterprise and the kinds of "Things" (entities) that have existence in that Enterprise. Therefore, The Zachman Framework for Enterprise Architecture is the ENTERPRISE ONTOLOGY.
Concluding Thoughts on Change
It is important to keep in mind that throughout this "Evolution," The Zachman Framework™ that you see today is NOT a new Framework- it is a new Framework graphic.
What Has Changed?
- Column Names- Communications Interrogatives and Enterprise Manifestations
- Row Names- Audience Contributor Roles
- Cell Names
- Row 6- Provision for Instances and Examples (to differentiate from Cell abstractions)
- Meta-model relates every Row to Row 6 for traceability and alignment
- Meta Entity Names- more precise and more business oriented
- Cell graphic icons now have "e.g.'s"
- Row 1 meta-entities are Mass nouns (Column Names)
- Modeling objectives by Row (Identification, Definition, etc.)
- No adjectives used in the Framework graphic
- Horizontal integrations are indicated by examples with lines connecting the Cell models
- Vertical transformations are indicated by the crooked arrows between the Rows.
- The Row and Column header names have been refined to more accurately express their meaning.
What Has NOT Changed?
- The Framework Theory
- All descriptive representations can be expressed in terms of Things and Relationships (i.e.: Thing-Relationship-Thing Models).
- The Logic of The Framework
- A two-dimensional classification system- a "schema"
- Communication Interrogatives (What, How, Where, Who, When and Why)
- Reification Transformations (Identification, Definition, Representation, Specification, Configuration, Instantiation)
- A two-dimensional classification system- a "schema"
- Each intersection (Cell) is a unique, independent variable (Class, Abstraction)- a "normalized" structure, one (meta) fact in one Cell
- The Cell context defines the meaning of the Enterprise Models' words
- The two-dimensional schema is depicted in matrix form
- Each "Primitive" Cell Model has two meta (meta, meta) entities- a "Thing" and a "Relationship"
- Comprehensive and Complete
- The Classification on both axises is comprehensive and complete- therefore, the intersections (Cells) have to be comprehensive and complete
